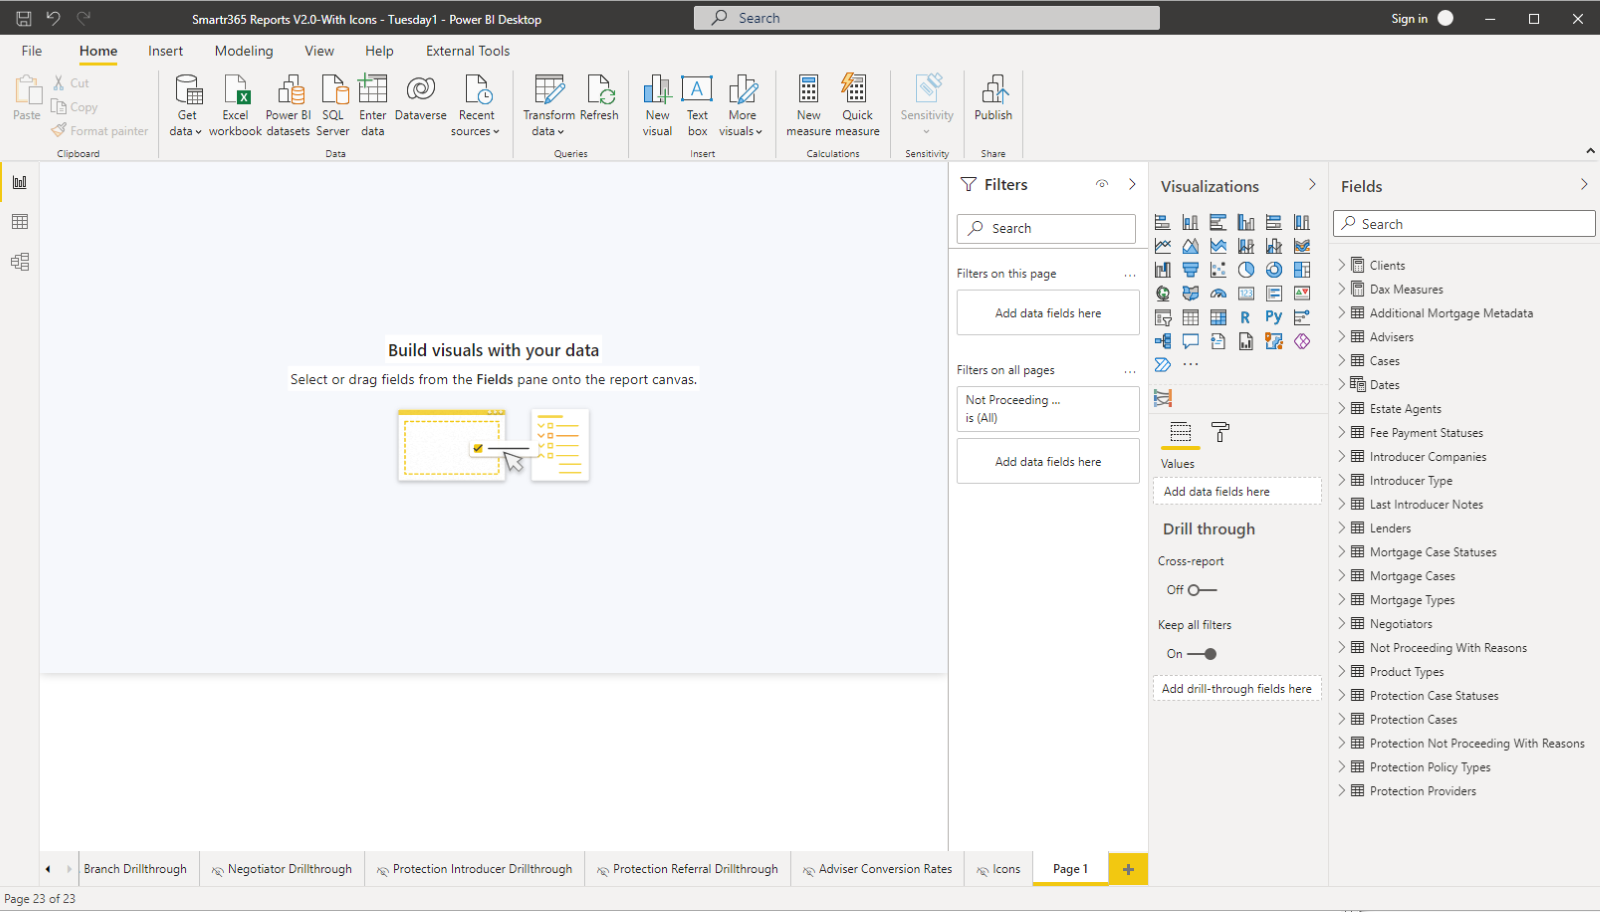
In this guide, we will create a new custom report using the Power BI Desktop application hooked up to the Smartr365 platform data.
Power BI Desktop is a free data modelling tool available from Microsoft. It uses DAX (Data Analysis Expressions) so that reports can perform calculations and apply formula. These are similar to excel formulas, in that they apply functions across datasets.
At Smartr365, we have created common measures which brokerages indicated they would commonly report on. You may want to augment these, if you wish to create custom logic which is not covered by the measures we have created. For most adhoc reporting, you can create simple tables which do not require this.
Before you start, you will need to have been granted access to your brokerage’s data lake and Power BI reporting by Smartr365.
Once you have your Power BI desktop open, and your Smartr365 template open, remember to always start by clicking Refresh which will pull the latest data into the system. New data from your platform is available on the hour, every hour.
Example 1:
‘I want to see what cases in Smartr365 are missing the Remortgage Date in Smartr365 so that I can see which advisers need more training’
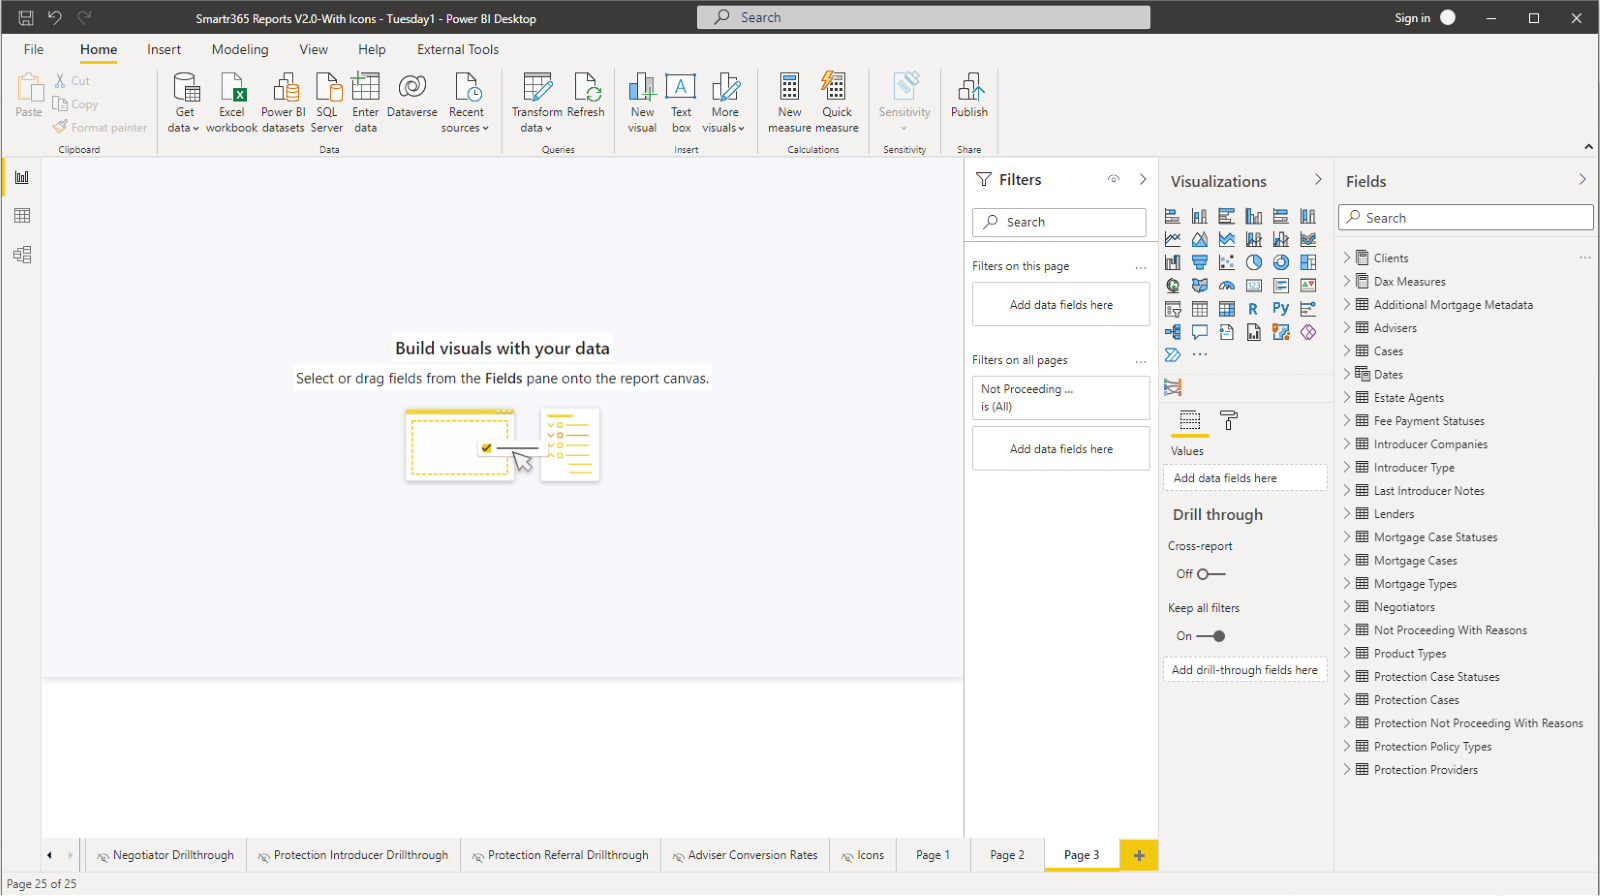
Open a new tab/page by clicking the (+) sign at the bottom right.
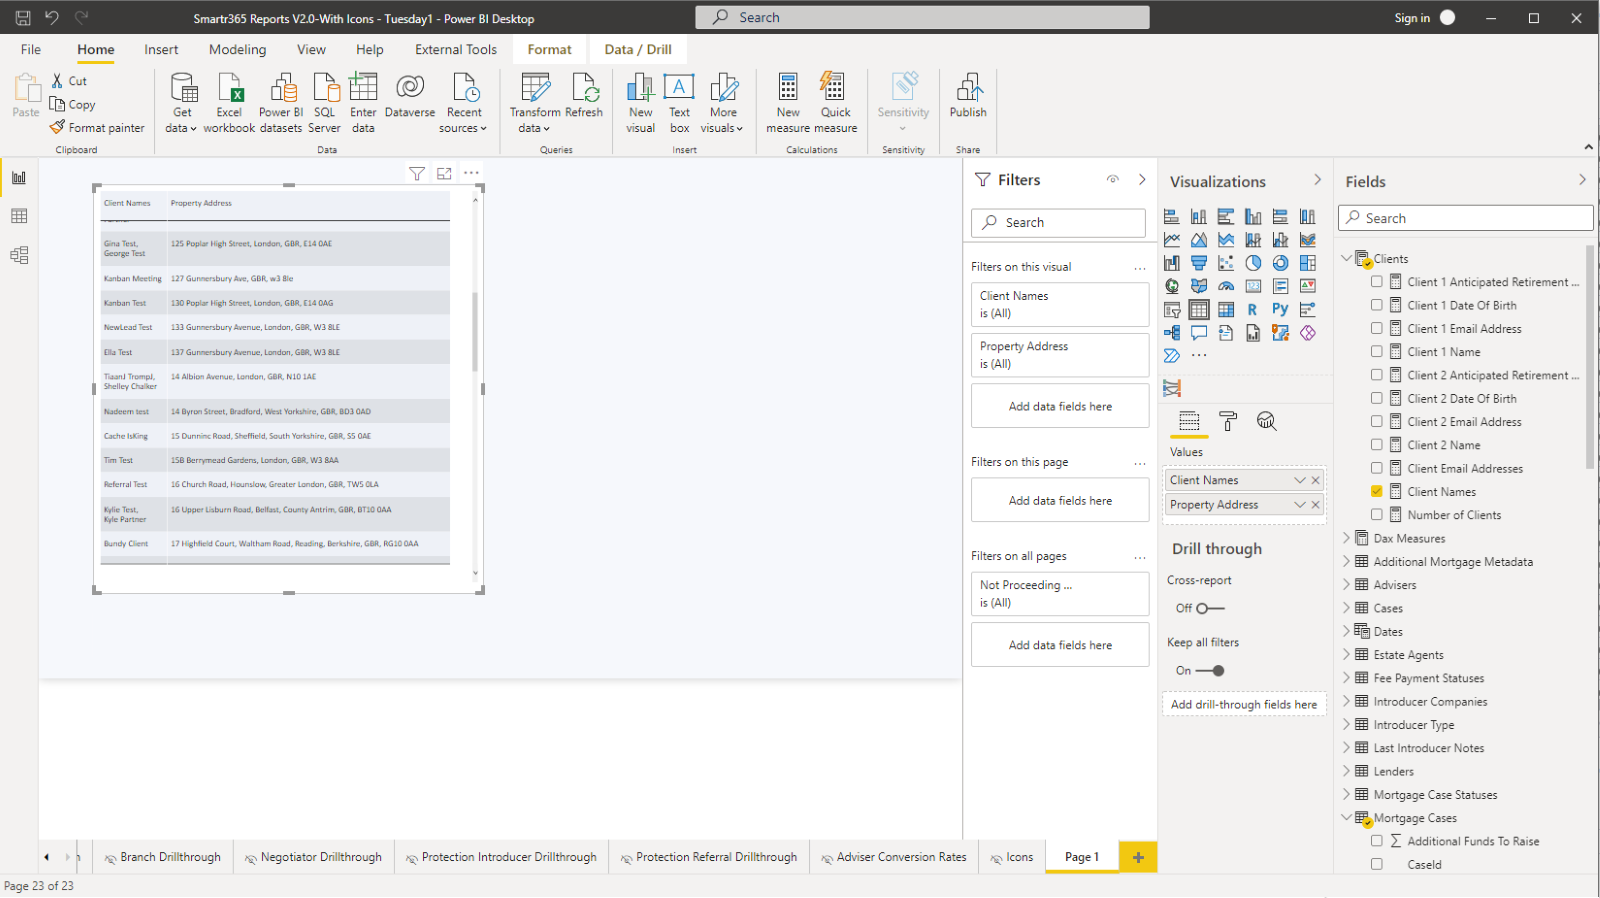
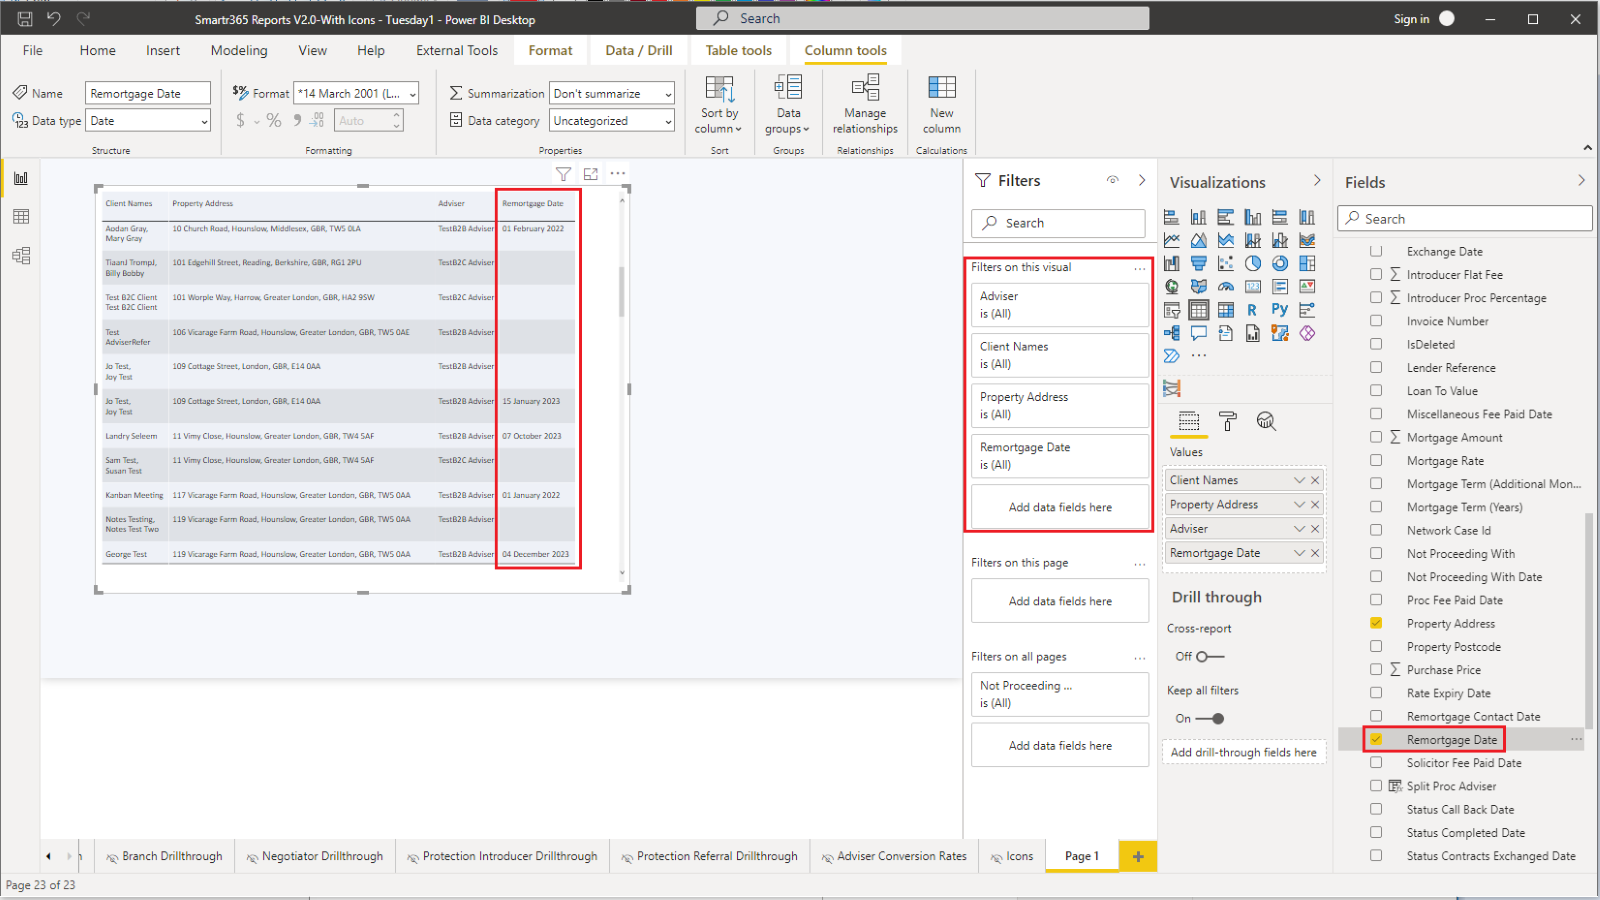
Add columns to the report by selecting the columns from the ‘Fields’ panel. In the screenshot below, we have expanded the Clients table and selected ‘Client Names’ and then the Mortgage Cases table and selected Property Address. Notice that as you select fields, they automatically drop into a new table on the left.
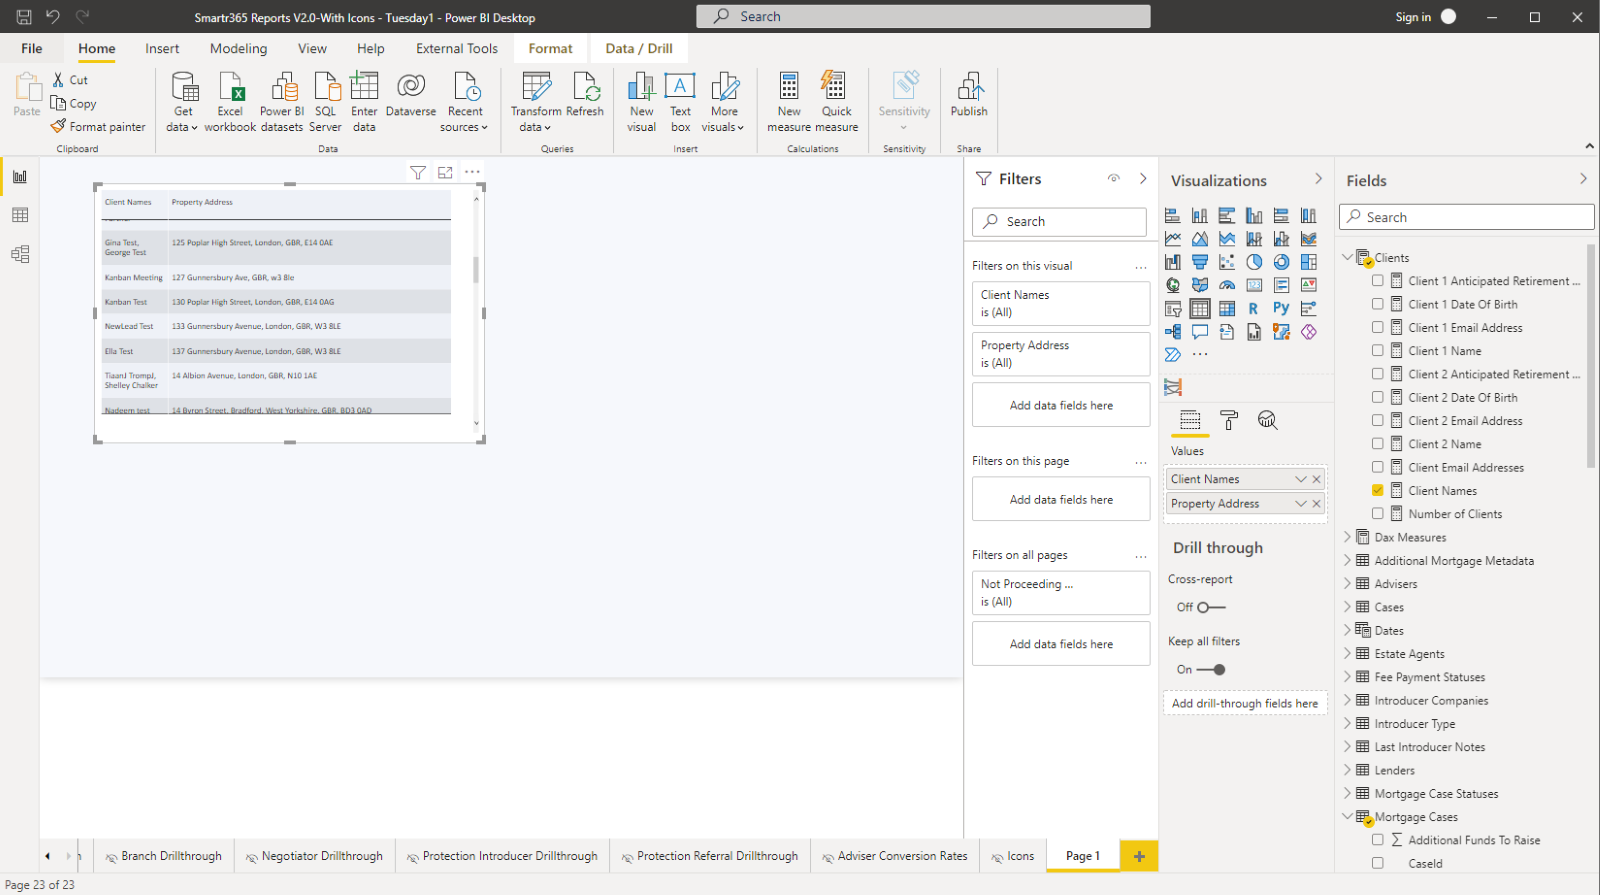
Expand the table on the left by dragging the corners or sides of the report.
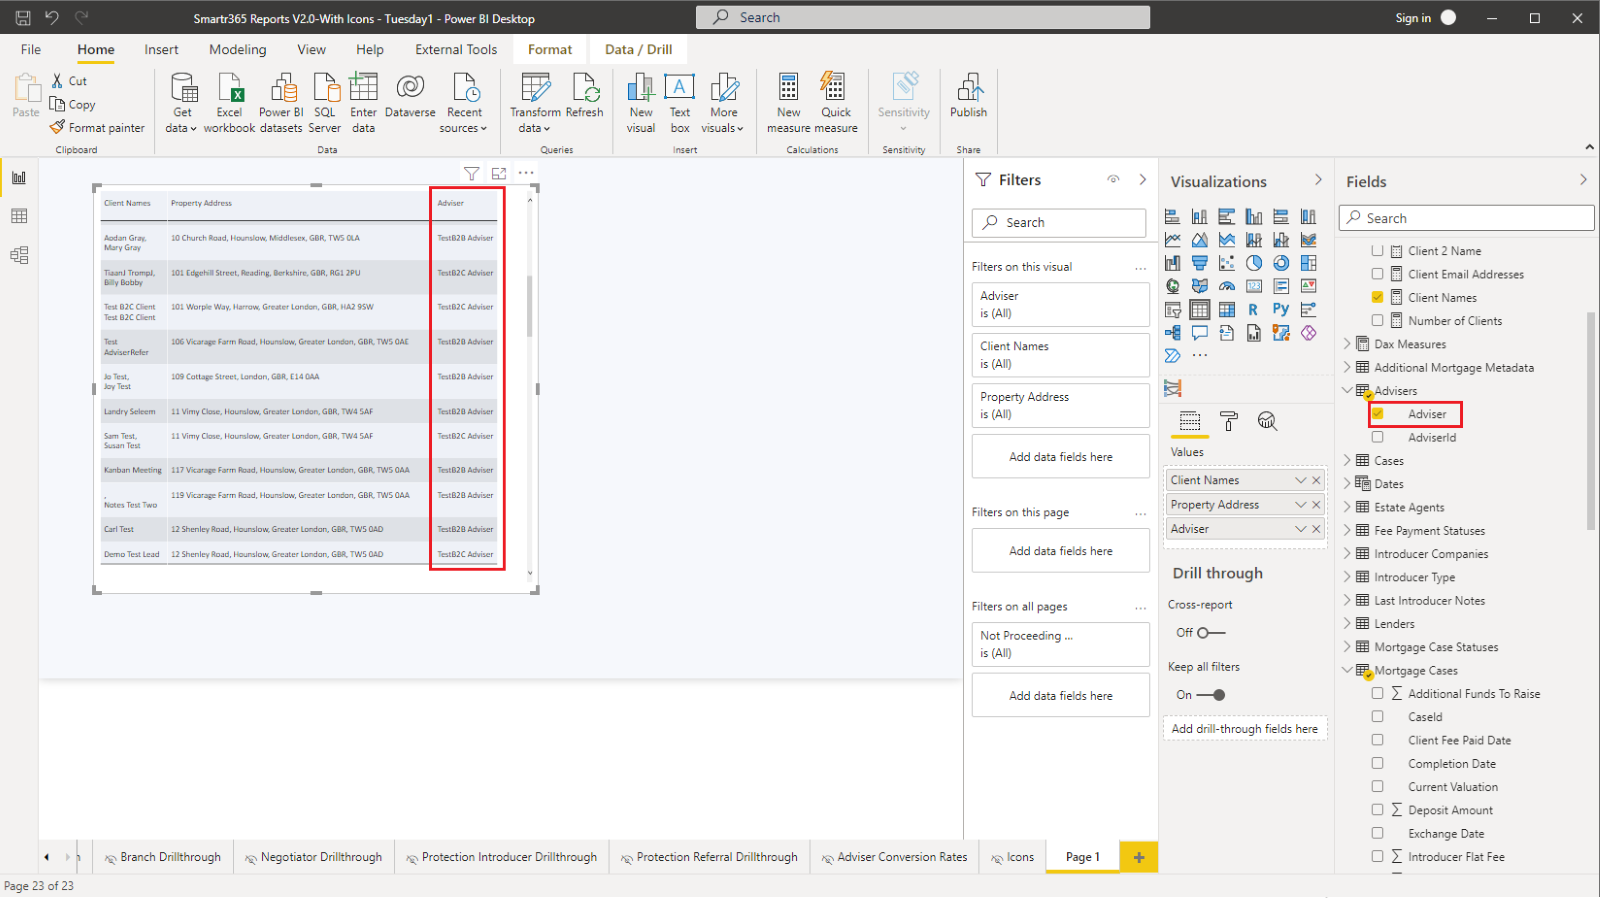
For this example, we want to include the Adviser assigned to each case. So let’s expand the Adviser folder, and click on Adviser field. It will be automatically added to the table on the left.
We want to find cases which are missing a Remortgage Date on the Smartr365, so let’s expand Mortgage Case field again and select Remortgage Date field. Notice how the fields are always listed alphabetically within a folder so that its easy for you to find them. The field is automatically added to the report on the left.
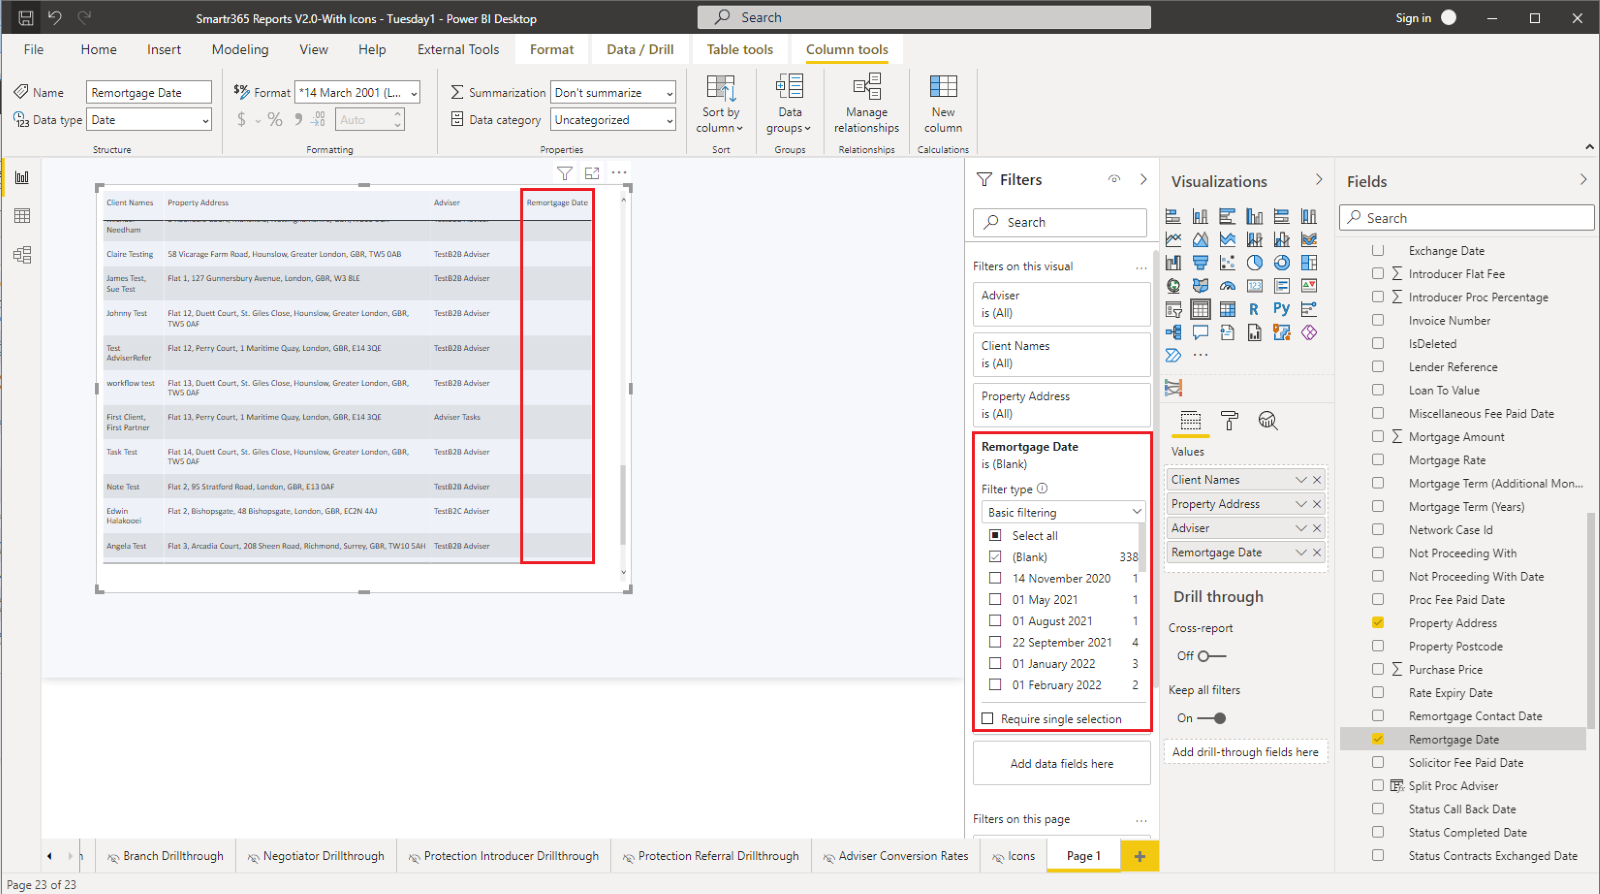
• Notice how all the columns selected for the report are also show in the Filters panel. You can apply filters to any column in the report.
• As we want to look for cases which have a missing Remortgage Date, let’s add some filtering with that field. Expand the card on the Filters panel for Remortgage Date (there is a small arrow which expands this card) and filter for Blank. The report will update to only show cases where the Remortgage Date is blank.
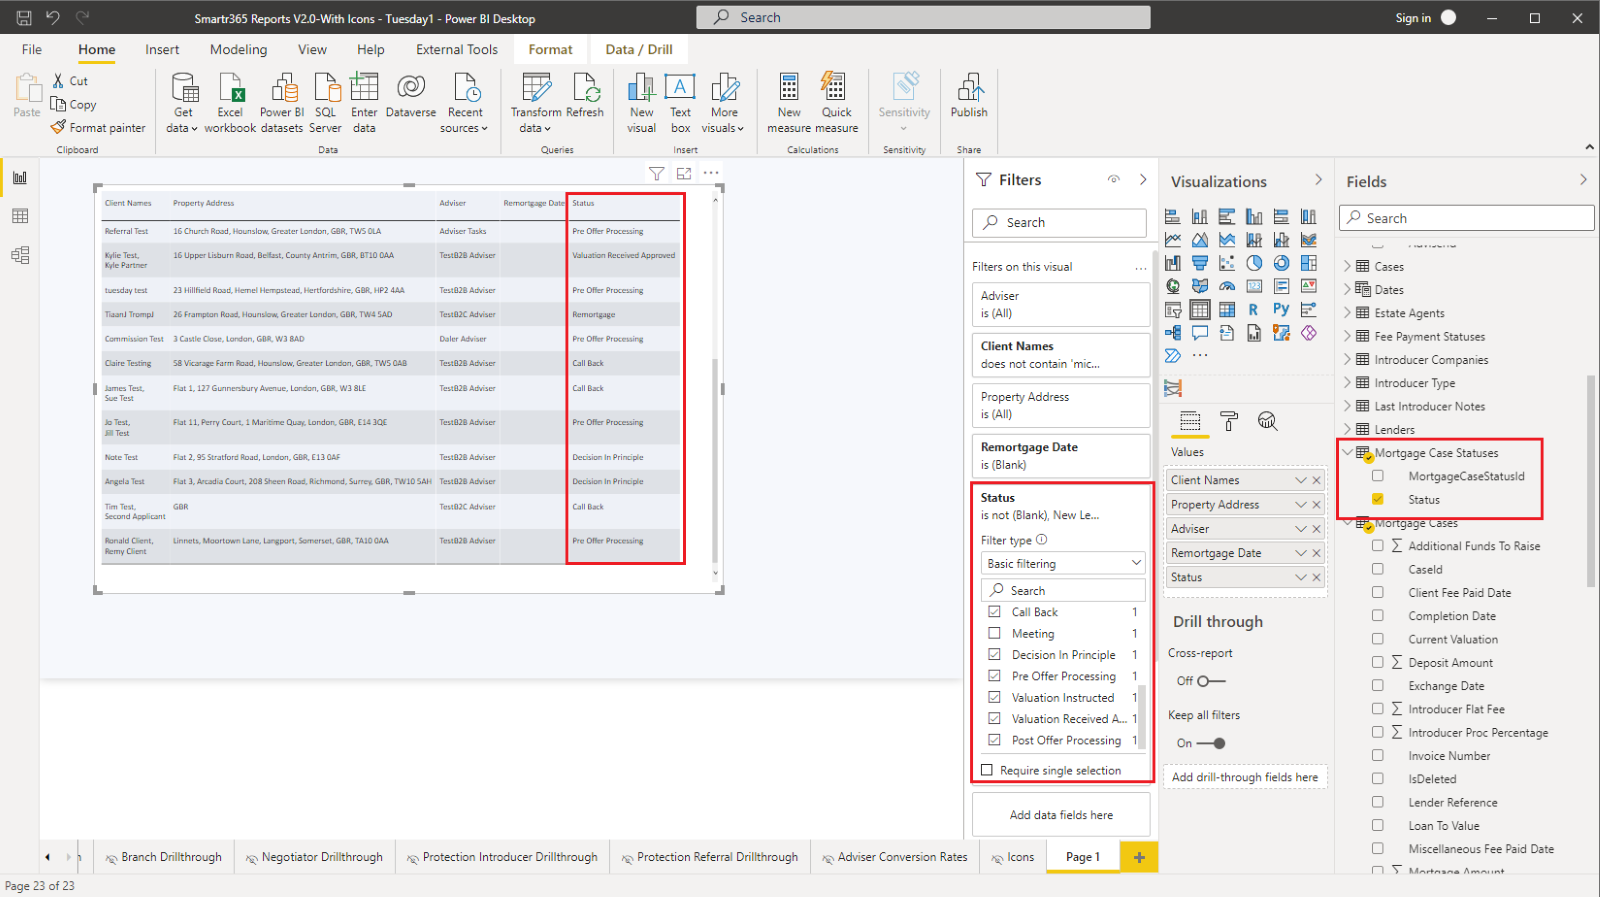
Perhaps, we are less concerned if cases are missing a Remortgage Date if they are near the top of the sales funnel. Let’s add the Mortgage Status to the report, and then filter out New Lead, Meeting, Call Back, Remortgage, and DIP status’. Follow the same steps above to first select the field to add to the report, then to expand the field on the Filters panel and filter out the status’ which are not applicable.
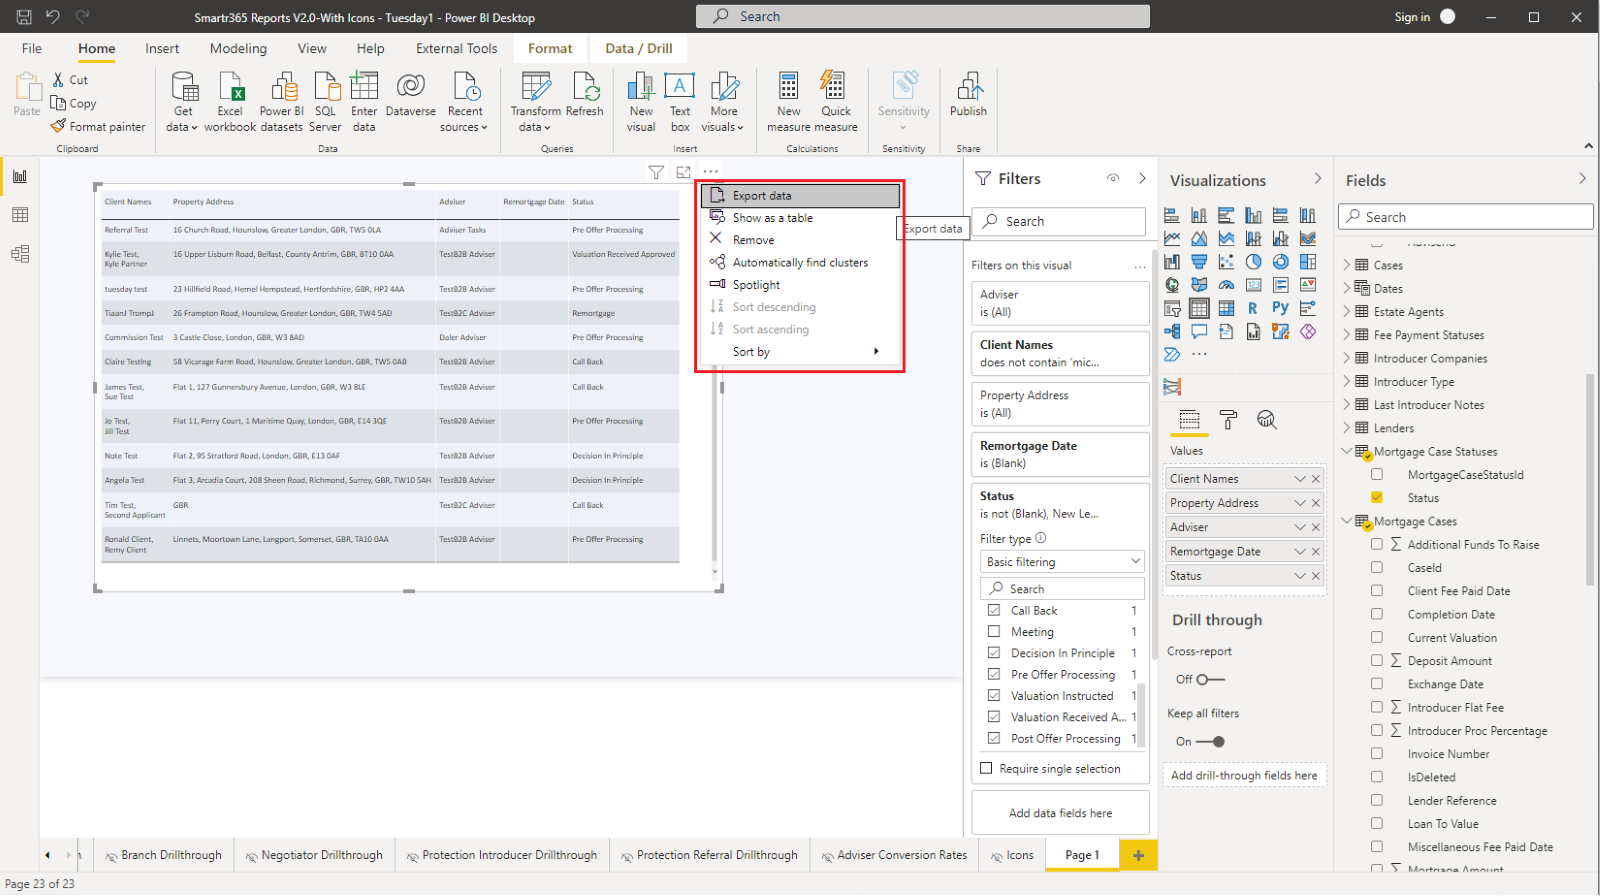
Let’s imagine that we want to email my advisers a list of all their cases which are missing this information, so that they can make the updates. To export to csv, click on the three dots to the upper right corner of the report and click Export csv.
Remember to save your report, especially if you have created one you will want to use again!
Example 2:
‘I want to see a list of all cases and the associated proc fees, for cases which were submitted in the month of May’
In Smartr365, we use the date cases moved to Pre-Offer Processing status to define ‘Submitted’ in our reports.
• Open a new tab/page by clicking the (+) sign at the bottom right.
Select the fields you want to include in the report to identify a case. Expand the Cases table and add the CaseId, then open the Clients table and select Client Names, and finally the Mortgage Cases table and select Property Address. Notice how they automatically populate on the table and how they are shown on the Values and Filters panels.
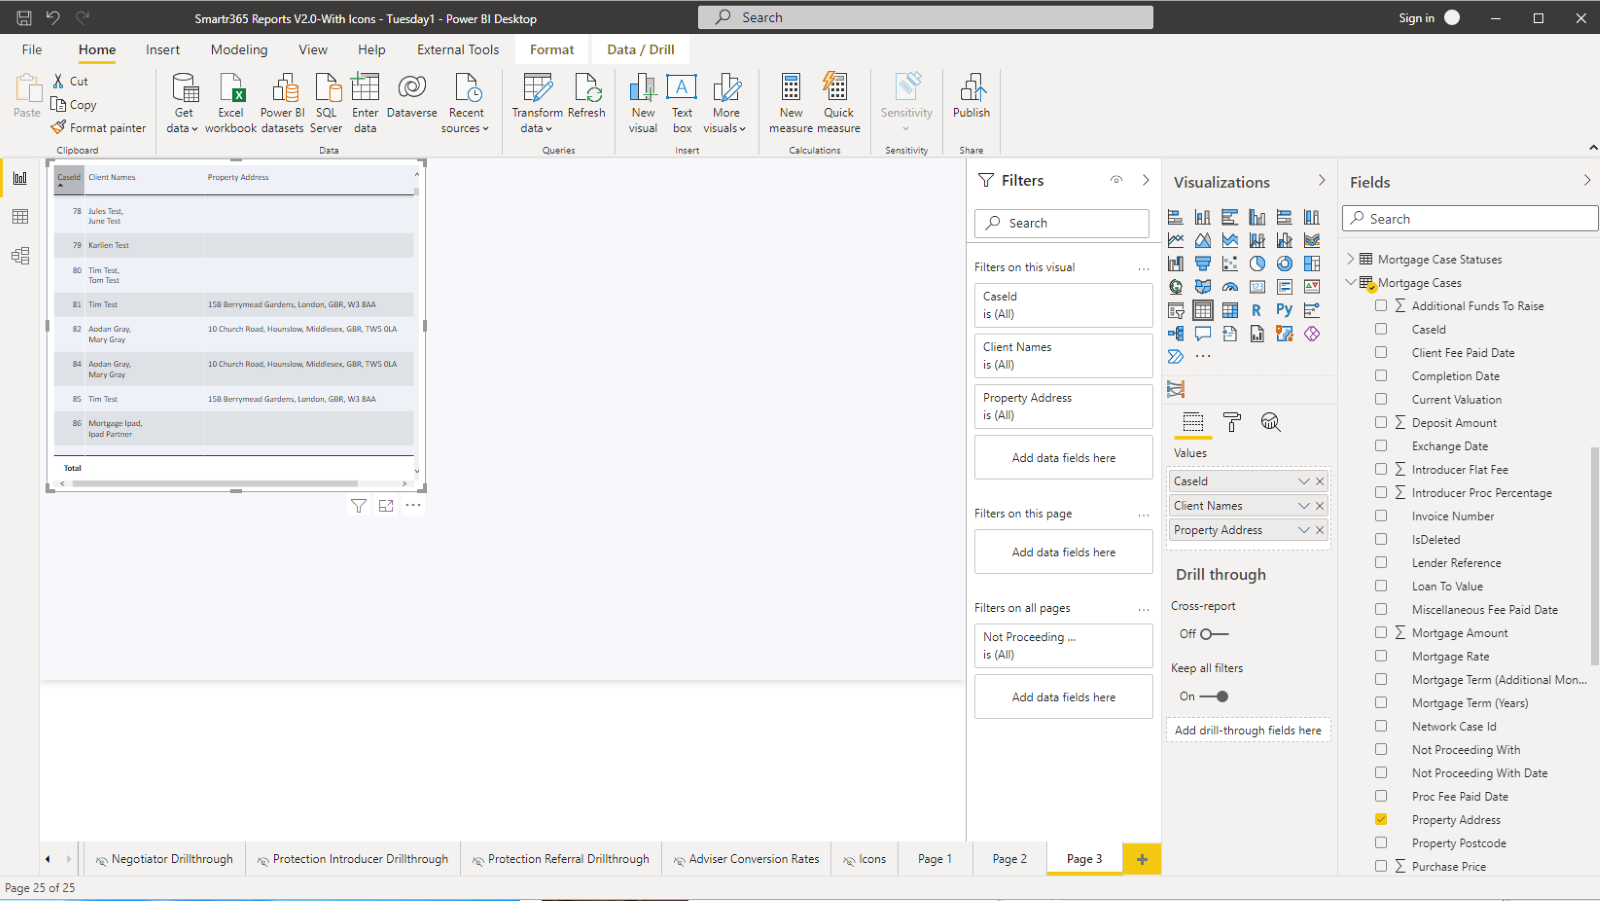
• Each time a case moves across the Kanban, Smartr365 records the date it entered that new status. In the Mortgage Case folder, you can see a list of all these Status-related fields. There are also the manually entered fields on the case in Smartr365 like Exchange date, Remortgage date and Rate related fields.
• Some of our DAX measures have logic build into them so that they ‘know’ which dates are important to them. For this example, we want to report on the Proc Fee for all cases which entered Pre Offer Processing status within a date range. So we should use a DAX measure for this report.
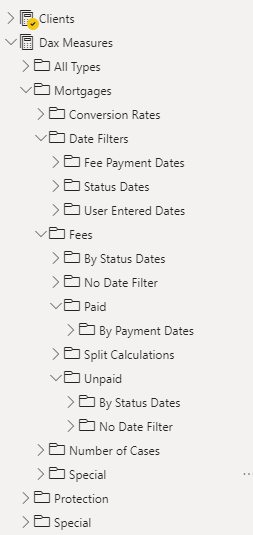
• Open the Mortgages folder under DAX Measures folder in the Fields panel. Smartr365 has grouped the measures into 4 folders, Conversion Rates, Date Filters, Fees, Number of Cases and Special.
*Note we have a separate guide with the details of each type of DAX measure [insert link]
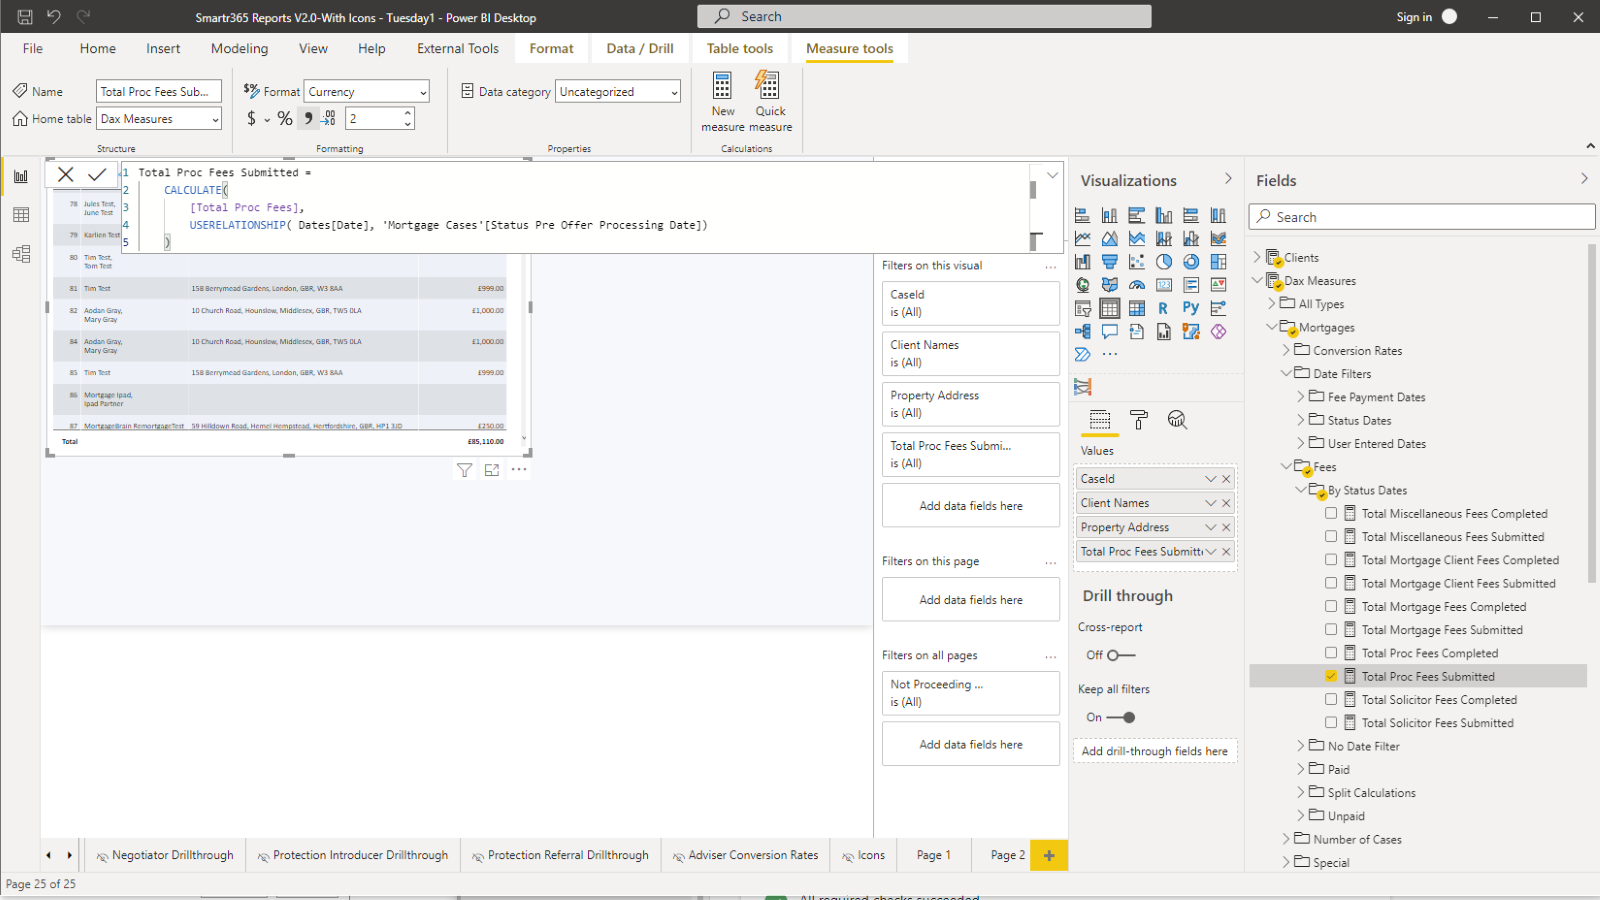
• As we want to create a report for the Proc Fees which were Submitted in a certain month, let’s expand Fees folder, then By Status Dates folder. Select the Total Proc Fees Submitted field. This field will filter across all the cases and find those were proc fee is not blank and were the case entered Pre-Offer Processing in a date range selected.
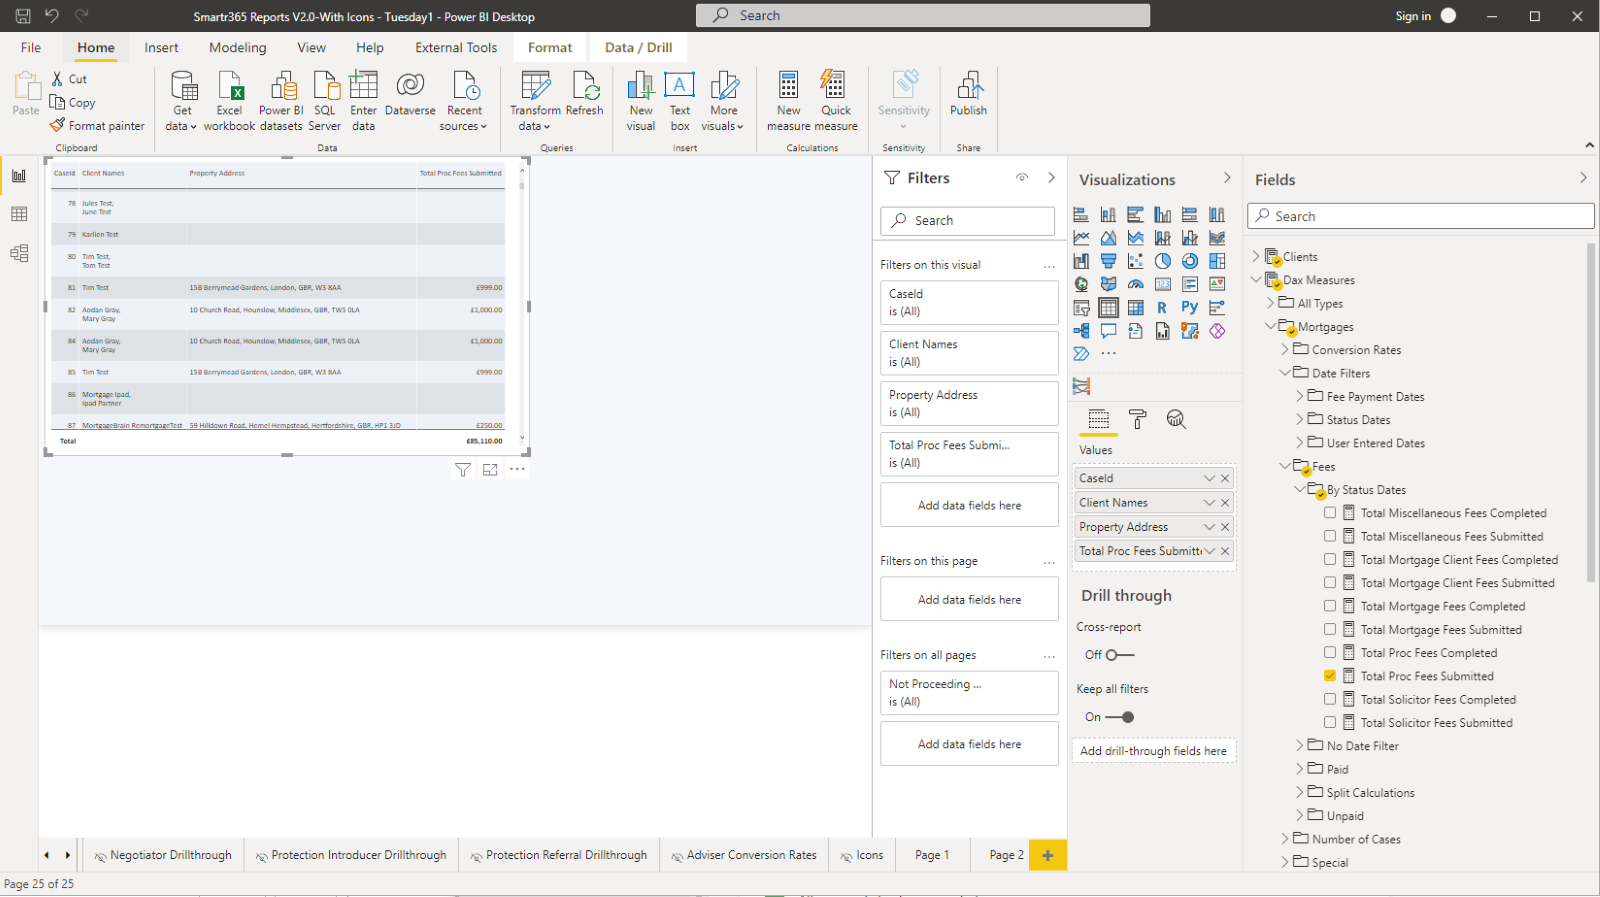
If you want to understand more about the DAX measure you can double- click on that field which will open a panel with the underlying function. notice how you can see that this measure is using the Status Pre-Offer Processing Date as the input to the Date field.
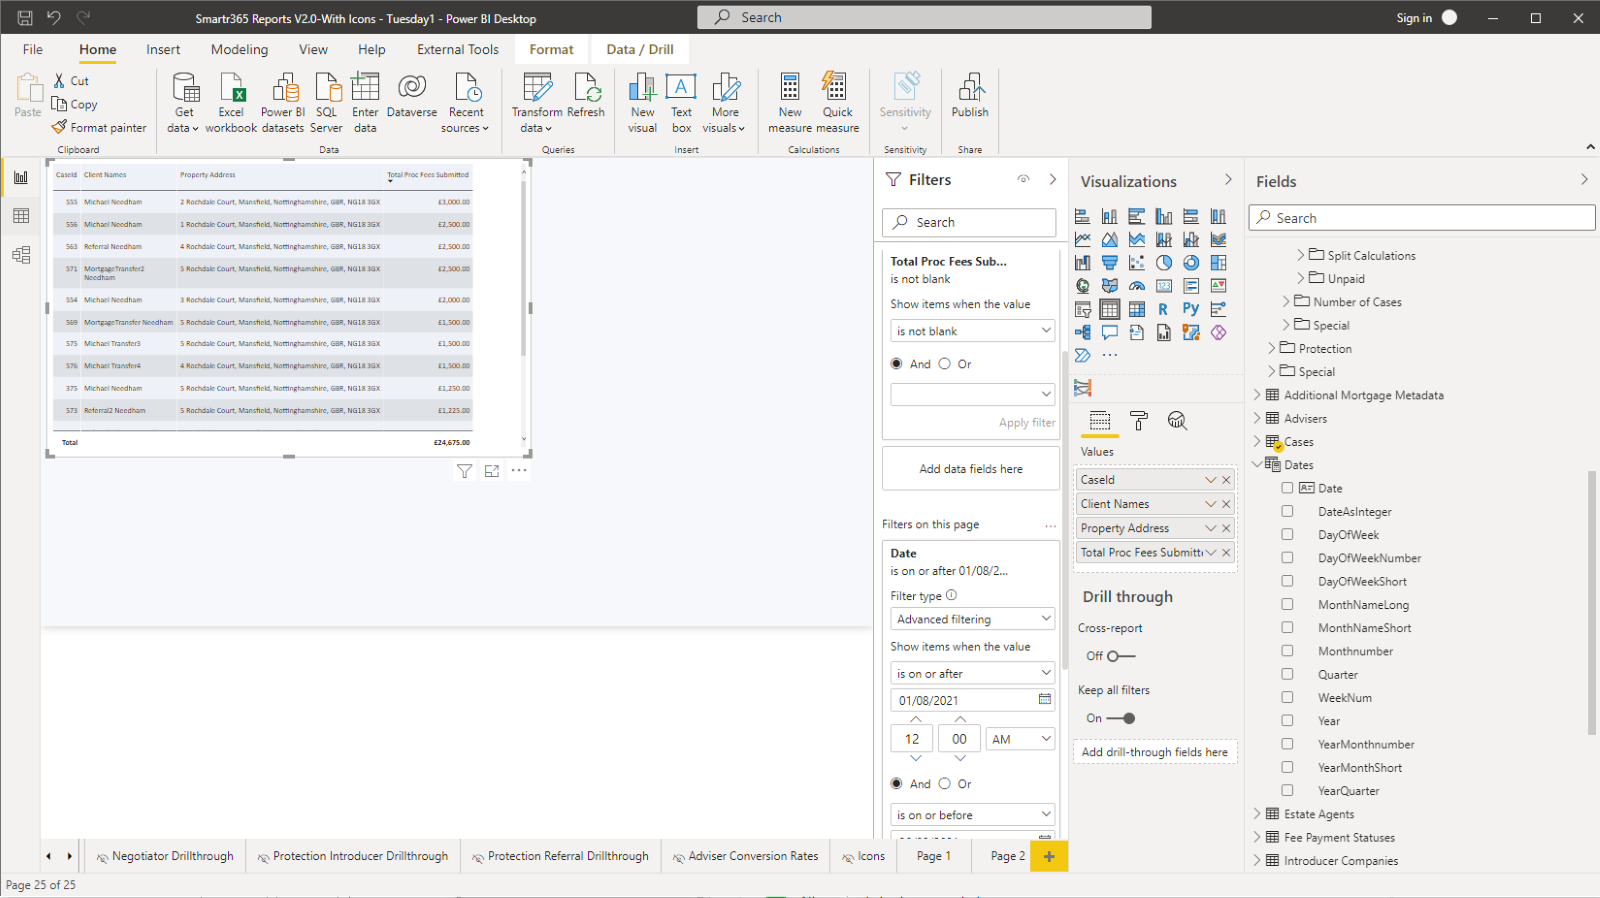
Drag the field ‘Date’ into the filter on this report section. Because we used the DAX measure, any filtering you apply to the Dates field, will automatically be used to pull sum the proc fee column. Using DAX measures with date fields is best practice in Power BI.
• In the screenshot above, notice how we have selected Advanced Filtering, and selected ‘is on or after’ and ‘is before’ to create a date range. Advanced filtering is not automatically applied. You mush click Apply Filter to apply this date range to the data shown in the report.
• Click Refresh to full in the latest data from Smartr365. Note that updated data is available on the hour, every hour from the Smartr365 platform.
Tips and Tricks for creating reports in Power BI
Filters apply per report page, this means if you want to view all reports for May, you will need to change date and click Apply Filter on each report on every tab
Power BI desktop app is best for creating reports but it is fiddly. You must select on the Visual before you can edit the report. If not, Power BI will create new tables by default.
Using the right DAX Measure is important and can become complicated if you want to combine multiple dates into the report logic. We suggest you keep the reports simple with one date input at a time, unless you want to become a DAX –writing Pro!
Comments
Please sign in to leave a comment.